jeverett
Double Eagle Member
Preface: this post will contain statistics, and may be best-directed at cgkdisc.
No, my rhetorical question is not actually rhetorical. I believe that the PDGA "rating interval compression formulas" are incorrect, and as such PDGA player round ratings (and subsequently player ratings) are not as accurate as they could be. The result of these formulas, from what data I've been able to collect so far, is that almost no recorded rounds for any event, for rounds above or below 1000, are being correctly rated. The discrepancy is typically very small, however may be much more pronounced on very short or very difficult courses.
Note: I am referencing the 2013 Gentlemen's Club Challenge for much of the following. Unfortunately, a ratings update has happened since the following calculations were run, making comparison with the original data more difficult. The results of that event can be found here:
http://www.pdga.com/tournament_results/99721
For any who are interested, here is a quick breakdown of how PDGA round ratings are calculated:
Step 1. Determine who really is a propagator. Unfortunately this part is actually annoying to do accurately with available data. For example, players without active PDGA memberships may still be propagators for an event, but their initial rating cannot be determined externally. Also, in order to be considered a propagator, a player must have played a sufficient number of previous rated rounds (i.e. they need more than to just have a rating), and this is very time-consuming (and sometimes impossible) to determine externally.
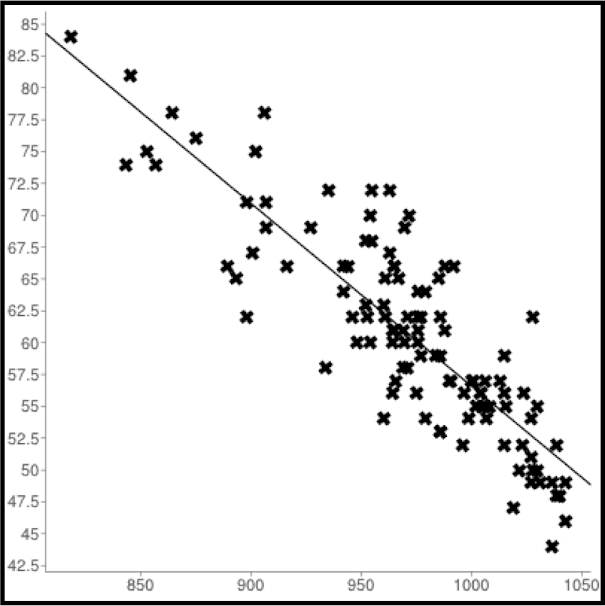
Step 2. Using all propagators, determine the best-fit linear equation that matches the round data. For example, here is a plot of round 1 of the 2013 Gentleman's Club Challenge (GCC):
The linear equation that best fits the above data is:
Round_Score = -0.12196922 * Initial_Rating + 182.4463478
Step 3. Determine the SSA for the round, using the best-fit linear equation above. As an example, for round 1 of the GCC, the SSA is approximately 60.47712771.
Step 4. Determine round ratings, using the following 'compression formulas':
For SSA's above 50.3289725:
Rating Increment = -0.225067 * SSA + 21.3858
For SSA's below 50.3289725:
Rating Increment = -0.487095 * SSA + 34.5734
Note: these formulas were derived from PDGA event results, and are not the precise formulas used by the PDGA. Unfortunately, due to rounding (of round ratings to the nearest whole number, and possibly also round of SSA values) it is impossible to exactly determine the actual linear formulas used. They are accurate, however, to within 0.01% of the actual PDGA linear formulas, and in the case of the GCC, accurately matched the 'unofficial' round ratings for each player in the round (subject to a small amount of rounding error). The rating increment for round 1, for example, was 7.774394297, or each throw off of the SSA increased or decreased the players' round rating by 7.774394297.
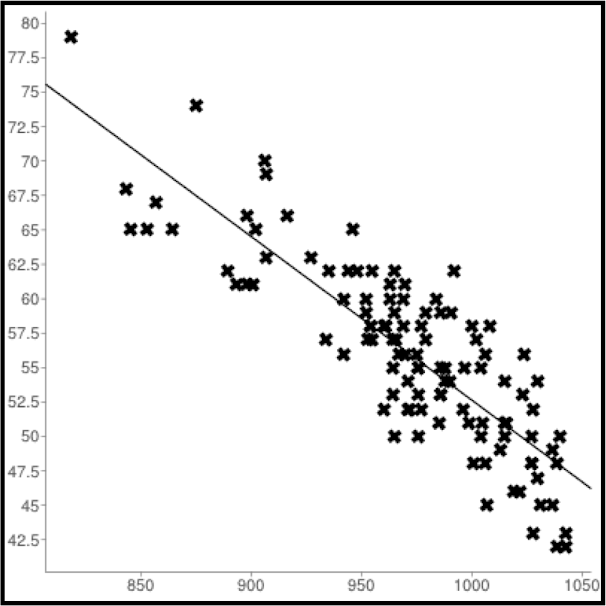
Step 5. Compare the round rating of each propagator with their initial rating, and throw out any propagator who's round rating was not within 50 point of their initial rating, and recalculate steps 2-4. Here is a plot of GCC round 1, with these propagators removed:
The linear equation that best fits the above data is:
Round_Score = -0.114947347 * Initial_Rating + 175.3579791
Producing a modified SSA of 60.41063194, and a new rating interval (using the same compression formula as above) of 7.789360301.
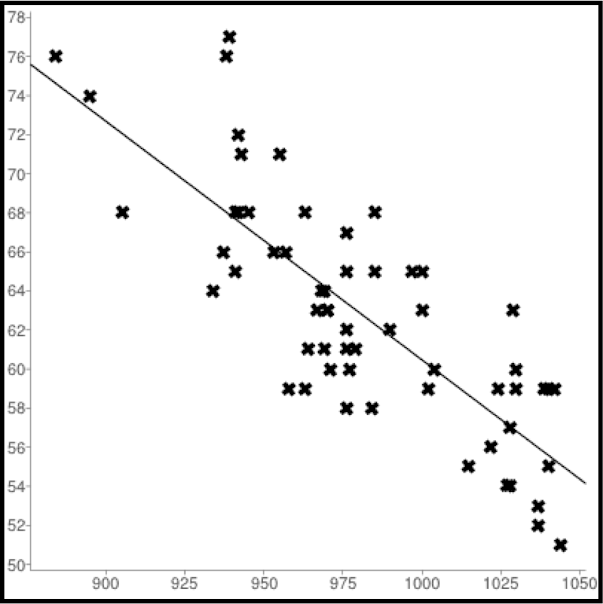
So.. what's wrong with any of this? Nothing.. yet. But what happens when you compare the linear equation that was used to compute the SSA with the rating interval compression formula value for that SSA? *If* it is valid to use a linear equation to model player rating vs. round score (and from the two plots above, plus countless other plots I've made from PDGA round data it does appear to be valid), should it not also be valid to use this same linear equation to determine the (averaged) number of rating points per throw? But this is not what the PDGA system does. For example, when you compare the rating interval used for each round of the GCC, against the observed rating-interval-per-throw-vs-initial-player-rating of all propagators, you get the following plot:
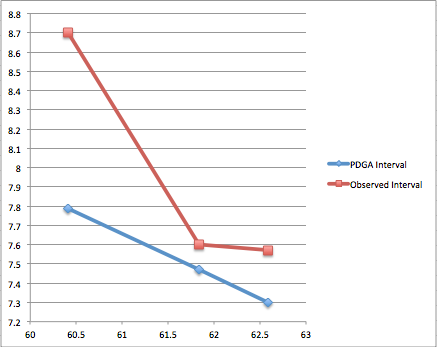
The PDGA Interval line above is of course this linear formula:
Rating_Increment = -0.225067 * SSA + 21.3858
But as you can observe, this in no way matches the observed rating interval based on player initial rating vs. round score, and the round data I've collected to date further supports this trend: that the relationship between initial player rating, round score, and round rating increment cannot be accurately predicted using the PDGA linear 'compression formula'. The effect of this is that round ratings are not (as) accurately reflecting the effect of player rating on round scores as they could be. In other words, if a 1020-rated player shoots an "average" round, by the PDGA compression formulas that round is not being rated a 1020. In fact, the only round rating not subject to this kind of induced error is of course a round rated exactly 1000.
What am I suggesting? I am suggesting that the PDGA instead switch to using the same linear equation used to determine SSA for a round to determine the per-throw rating increment. For example, for round 1 of the GCC, this would mean a round that was rated as a 1020 (technically a round score of 57.8430269985) would instead be rated as a 1022.3372266 (or rounded to a 1022). Yes, this difference is very small..
So why does it really matter? The goal here is correlation.. or more specifically the correlation between (initial) player rating and round/event score. i.e. How well did the initial ratings of all players predict how they scored at an event. I don't know if anyone has seen the PDGA report on correlation coefficients for their events (it was published last year), but increasing the correlation coefficient for Majors appears to be a goal of theirs. This of course can also be addressed with course design, but a very simple way to improve the correlation coefficient could be to switch how round ratings themselves are calculated. I don't, however, have any method of proving that this change will work.. and that's where I'd *love* some help (maybe even from Chuck). In order to test this, the 'real' PDGA method of determining SSA and rating intervals per throw would need to be used, using the precise number and ratings of propagators for real events, and then we'd need to test the impact both round rating methods would have on first player ratings and then the correlation coefficient of how well future event rounds are predicted by said player ratings.
Ok.. wall of text over.. thoughts?
No, my rhetorical question is not actually rhetorical. I believe that the PDGA "rating interval compression formulas" are incorrect, and as such PDGA player round ratings (and subsequently player ratings) are not as accurate as they could be. The result of these formulas, from what data I've been able to collect so far, is that almost no recorded rounds for any event, for rounds above or below 1000, are being correctly rated. The discrepancy is typically very small, however may be much more pronounced on very short or very difficult courses.
Note: I am referencing the 2013 Gentlemen's Club Challenge for much of the following. Unfortunately, a ratings update has happened since the following calculations were run, making comparison with the original data more difficult. The results of that event can be found here:
http://www.pdga.com/tournament_results/99721
For any who are interested, here is a quick breakdown of how PDGA round ratings are calculated:
Step 1. Determine who really is a propagator. Unfortunately this part is actually annoying to do accurately with available data. For example, players without active PDGA memberships may still be propagators for an event, but their initial rating cannot be determined externally. Also, in order to be considered a propagator, a player must have played a sufficient number of previous rated rounds (i.e. they need more than to just have a rating), and this is very time-consuming (and sometimes impossible) to determine externally.
Step 2. Using all propagators, determine the best-fit linear equation that matches the round data. For example, here is a plot of round 1 of the 2013 Gentleman's Club Challenge (GCC):
The linear equation that best fits the above data is:
Round_Score = -0.12196922 * Initial_Rating + 182.4463478
Step 3. Determine the SSA for the round, using the best-fit linear equation above. As an example, for round 1 of the GCC, the SSA is approximately 60.47712771.
Step 4. Determine round ratings, using the following 'compression formulas':
For SSA's above 50.3289725:
Rating Increment = -0.225067 * SSA + 21.3858
For SSA's below 50.3289725:
Rating Increment = -0.487095 * SSA + 34.5734
Note: these formulas were derived from PDGA event results, and are not the precise formulas used by the PDGA. Unfortunately, due to rounding (of round ratings to the nearest whole number, and possibly also round of SSA values) it is impossible to exactly determine the actual linear formulas used. They are accurate, however, to within 0.01% of the actual PDGA linear formulas, and in the case of the GCC, accurately matched the 'unofficial' round ratings for each player in the round (subject to a small amount of rounding error). The rating increment for round 1, for example, was 7.774394297, or each throw off of the SSA increased or decreased the players' round rating by 7.774394297.
Step 5. Compare the round rating of each propagator with their initial rating, and throw out any propagator who's round rating was not within 50 point of their initial rating, and recalculate steps 2-4. Here is a plot of GCC round 1, with these propagators removed:
The linear equation that best fits the above data is:
Round_Score = -0.114947347 * Initial_Rating + 175.3579791
Producing a modified SSA of 60.41063194, and a new rating interval (using the same compression formula as above) of 7.789360301.
So.. what's wrong with any of this? Nothing.. yet. But what happens when you compare the linear equation that was used to compute the SSA with the rating interval compression formula value for that SSA? *If* it is valid to use a linear equation to model player rating vs. round score (and from the two plots above, plus countless other plots I've made from PDGA round data it does appear to be valid), should it not also be valid to use this same linear equation to determine the (averaged) number of rating points per throw? But this is not what the PDGA system does. For example, when you compare the rating interval used for each round of the GCC, against the observed rating-interval-per-throw-vs-initial-player-rating of all propagators, you get the following plot:
The PDGA Interval line above is of course this linear formula:
Rating_Increment = -0.225067 * SSA + 21.3858
But as you can observe, this in no way matches the observed rating interval based on player initial rating vs. round score, and the round data I've collected to date further supports this trend: that the relationship between initial player rating, round score, and round rating increment cannot be accurately predicted using the PDGA linear 'compression formula'. The effect of this is that round ratings are not (as) accurately reflecting the effect of player rating on round scores as they could be. In other words, if a 1020-rated player shoots an "average" round, by the PDGA compression formulas that round is not being rated a 1020. In fact, the only round rating not subject to this kind of induced error is of course a round rated exactly 1000.
What am I suggesting? I am suggesting that the PDGA instead switch to using the same linear equation used to determine SSA for a round to determine the per-throw rating increment. For example, for round 1 of the GCC, this would mean a round that was rated as a 1020 (technically a round score of 57.8430269985) would instead be rated as a 1022.3372266 (or rounded to a 1022). Yes, this difference is very small..
So why does it really matter? The goal here is correlation.. or more specifically the correlation between (initial) player rating and round/event score. i.e. How well did the initial ratings of all players predict how they scored at an event. I don't know if anyone has seen the PDGA report on correlation coefficients for their events (it was published last year), but increasing the correlation coefficient for Majors appears to be a goal of theirs. This of course can also be addressed with course design, but a very simple way to improve the correlation coefficient could be to switch how round ratings themselves are calculated. I don't, however, have any method of proving that this change will work.. and that's where I'd *love* some help (maybe even from Chuck). In order to test this, the 'real' PDGA method of determining SSA and rating intervals per throw would need to be used, using the precise number and ratings of propagators for real events, and then we'd need to test the impact both round rating methods would have on first player ratings and then the correlation coefficient of how well future event rounds are predicted by said player ratings.
Ok.. wall of text over.. thoughts?